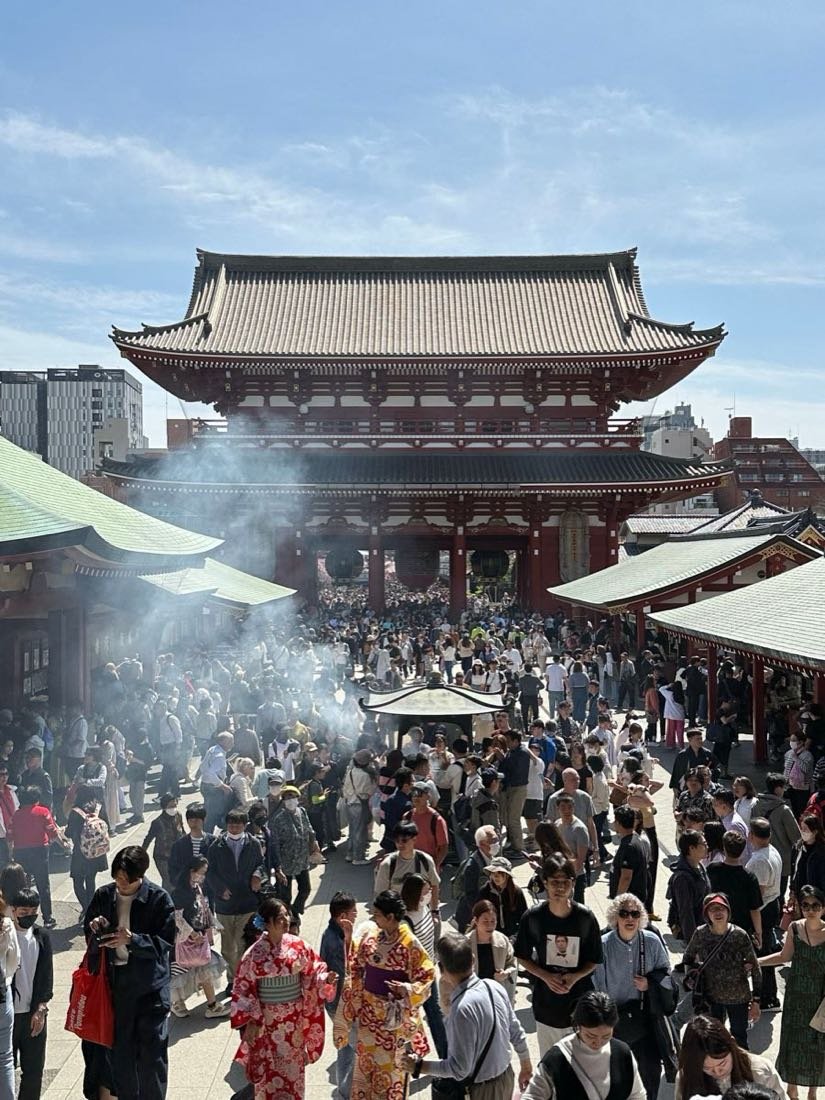
Japan set a new inbound tourism record in 2024, welcoming approximately 36.87 million international visitors - the highest figure in the country’s history. After a near-complete shutdown during 2020–2021, arrivals have rebounded faster than almost any other major destination. These are the numbers that define that recovery, and the context behind them.
Headline Figures at a Glance
- 2024 arrivals: approximately 36.87 million (JNTO)
- Previous record: 31.88 million (2019)
- Tourism consumption: approximately ¥8.1 trillion ($54 billion) in 2024
- Average spend per visitor: approximately ¥232,000 ($1,550)
- Average length of stay: approximately 11.2 nights
- Tourism share of GDP: approximately 9.1% of total GDP (WTTC, 2025 estimate)
The average spend figure is partly driven by the weak yen: in 2024, ¥1 bought more for overseas visitors than at any point in three decades, making Japan exceptionally affordable in dollar and euro terms while inflating yen-denominated revenue totals.
Top Source Markets
South Korea leads by volume, driven by short flying distances and affordable airfares. China, which accounted for nearly 30% of all arrivals in 2019, has not yet returned to those levels but ranked second in 2024. The United States remains the largest Western source market by a significant margin.
| Rank | Market | Approximate 2024 Arrivals |
|---|---|---|
| 1 | South Korea | 8.8 million |
| 2 | China | 6.8 million |
| 3 | Taiwan | 4.2 million |
| 4 | Hong Kong | 2.7 million |
| 5 | United States | 2.6 million |
| 6 | Thailand | 1.3 million |
| 7 | Australia | 0.8 million |
| 8 | Singapore | 0.7 million |
Source: JNTO monthly statistics, January–December 2024. Figures rounded to one decimal place.
Short-haul Northeast Asian markets (South Korea, China, Taiwan, Hong Kong) collectively account for approximately 60% of all arrivals. The United States leads long-haul source markets by visitor count, though European visitors typically stay longer and spend more per trip.
Tourism Revenue
Japan Tourism Agency data place total inbound tourism consumption at approximately ¥8.1 trillion in 2024 - roughly equivalent to the annual GDP of a mid-sized European economy. The breakdown by spending category:
- Accommodation: approximately 34% of total spend
- Shopping: approximately 27%
- Food and beverage: approximately 19%
- Transport (in-country): approximately 11%
- Attractions and activities: approximately 9%
Shopping has historically been the largest single category for Chinese and South Korean visitors. Western visitors - particularly Americans, Australians and Europeans - tend to allocate proportionally more to food, accommodation and guided experiences.
Japan Tourism Agency projects that its 2030 goal of ¥15 trillion in inbound tourism consumption remains achievable, contingent on continued yen weakness or targeted growth in high-yield markets.
Seasonality
Japan has two pronounced peak seasons and meaningful shoulder periods. Accommodation prices and crowd levels correlate closely with sakura (cherry blossom) in March–April and autumn foliage in November.
| Month | Visitor Index | Notes |
|---|---|---|
| January | Low | Post-New Year lull; good value |
| February | Low | Plum blossoms; Sapporo Snow Festival |
| March | High | Sakura begins in Kyushu, reaches Tokyo |
| April | Very High | Peak sakura; Golden Week late-April rush |
| May | High | Golden Week (late Apr–early May); then settles |
| June | Moderate | Rainy season; fewer crowds |
| July | Moderate–High | Festivals; school holidays |
| August | High | Obon; domestic travel peak |
| September | Moderate | Typhoon risk; autumn not yet started |
| October | High | Autumn foliage begins in Hokkaido |
| November | Very High | Peak foliage across Honshu |
| December | Moderate | Quiet after foliage; illuminations |
The clearest off-peak windows for budget-conscious travellers are January–February and mid-June to mid-July (rainy season). Attractions remain open and prices are visibly lower.
Average Trip Profile
Based on Japan Tourism Agency 2024 visitor survey data:
- Average stay: approximately 11.2 nights (longer for Western visitors - US average approximately 14.5 nights)
- Average spend: approximately ¥232,000 (~$1,550) total per trip
- Daily spend: approximately ¥20,700 (~$138)
- Most visited regions: Tokyo (nearly all), Osaka/Kyoto (approximately 78%), Hiroshima (approximately 31%), Hokkaido (approximately 18%)
- Primary purpose of visit: sightseeing/tourism (approximately 78%), visiting friends and relatives (approximately 12%), business (approximately 7%)
- Accommodation type: hotel (approximately 64%), ryokan or traditional inn (approximately 28%)
Western visitors score Japan higher on food and cultural authenticity than on value for nightlife - a consistent finding across visitor satisfaction surveys since 2018.
Safety and Infrastructure
Japan consistently ranks among the world’s safest and most tourist-ready destinations:
- Global Peace Index 2024: 9th globally (Institute for Economics and Peace)
- Tourism Competitiveness Index: 4th globally (World Economic Forum, 2024)
- Safe Cities Index: Tokyo ranked 1st globally (Economist Intelligence Unit, 2023)
- Healthcare quality: Japan has among the highest doctor-to-patient ratios in the OECD; major cities have clinics with English-speaking staff
- Transport infrastructure: Shinkansen network connects 11 of Japan’s 13 largest cities; IC card payment accepted on most urban transit
English signage has expanded significantly since 2019, particularly on the Shinkansen network and at major tourist sites. A 2024 JNTO visitor survey found 91% of international visitors rated their overall experience 4 or 5 out of 5.
Five-Year Arrival Trend
| Year | Arrivals | Change vs Prior Year | Notes |
|---|---|---|---|
| 2019 | 31.88 million | +2.2% | Pre-pandemic record |
| 2020 | 4.11 million | −87.1% | Borders closed March 2020 |
| 2021 | 0.25 million | −93.9% | Near-total closure |
| 2022 | 17.40 million | n/a | Reopened to individuals October 2022 |
| 2023 | 25.07 million | +44.1% | Strong recovery across all markets |
| 2024 | 36.87 million | +47.1% | New all-time record |
Source: JNTO. 2022 figure covers October–December independent arrivals plus limited tour groups January–September.
The V-shaped recovery is sharper than any other G7 country destination. Japan’s prolonged closure (it was among the last major economies to reopen to independent tourists) compressed latent demand into 2023 and 2024 arrivals - a pattern also visible in individual source market data.
What These Numbers Mean for Travellers
Record arrivals have direct practical implications:
Crowds: Popular sites - Arashiyama bamboo grove, Fushimi Inari, Miyajima - now require crowd management strategies. Visit early (before 08:00) or late (after 17:00) in peak months.
Accommodation pricing: Kyoto room rates in March–April and November average 60–80% higher than January rates. Book three to six months ahead for peak periods.
Reservation culture: High-rated restaurants - particularly kaiseki and sushi counters - now operate waiting lists measured in weeks, not days. Research and reserve before arrival.
Overtourism response: Several municipalities have introduced visitor controls. Fujikawaguchiko restricted photography from a convenience store car park; Kyoto has restricted tourist access to some geisha districts. These measures may expand.
The Japanese government has set a target of 60 million annual visitors by 2030 and is actively promoting regional dispersal - Tohoku, Shikoku and Kyushu - to distribute economic benefit and reduce pressure on Tokyo, Kyoto and Osaka.
Data in this article draws on JNTO monthly arrival statistics, Japan Tourism Agency Annual Survey on Inbound Tourism Consumption, World Tourism Organization (UNWTO) Asia-Pacific data, and WTTC Economic Impact Research 2025. Statistics are updated annually each January.